The Baselight Data Catalog is your starting point for exploring structured datasets across crypto, finance, science, and more. Whether you’re tracking DeFi activity, building AI models, or analyzing economic signals, the catalog provides fast and easy access to reliable data that is ready to query and build with.
What is the Baselight Catalog?
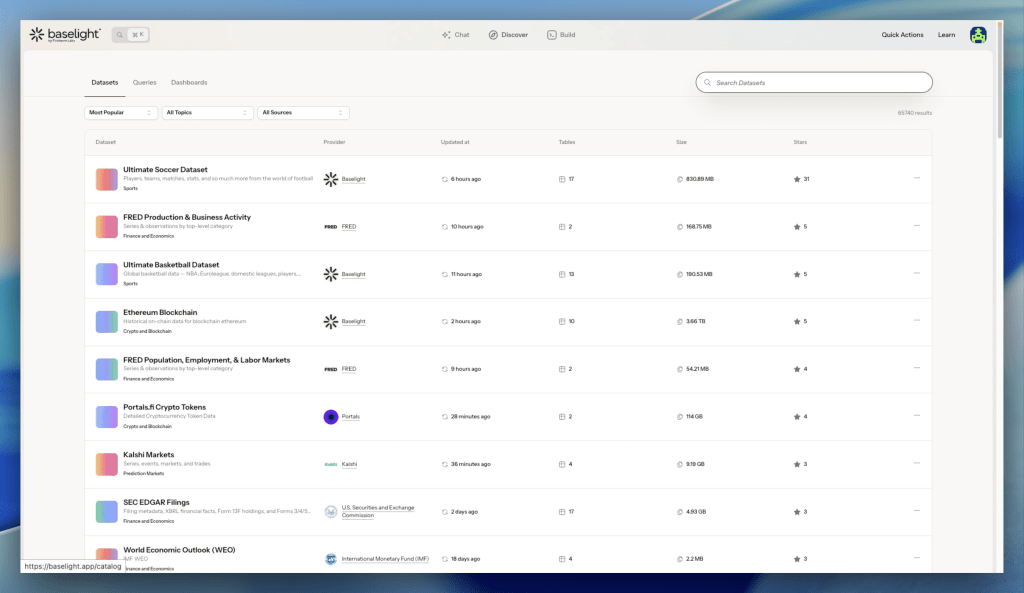
The data catalog is a searchable, filterable index of all datasets available on Baselight. Each dataset is structured, versioned, and instantly queryable. Datasets may contain multiple tables that users can query. For example, the World Bank Group’s dataset titled Global Financial Inclusion And Consumer Protection Survey has 347 different structured tables looking at different economic benchmarks. Users can browse data across categories, providers, and topics, making it easy to find the information they need without complex setup.
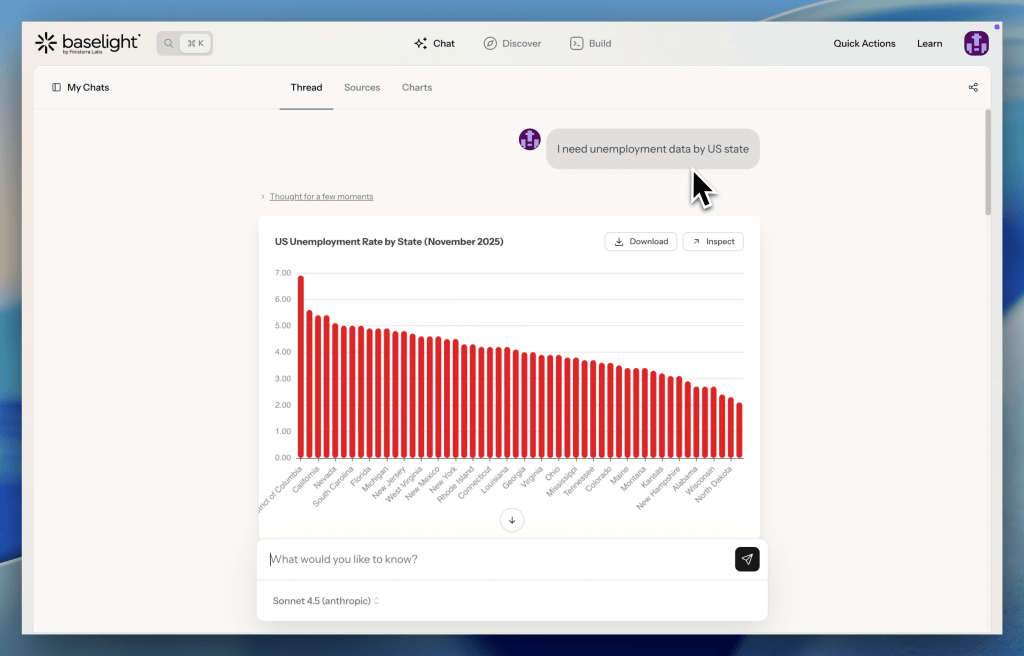
There are two ways to find data: through the Discover section or through Baselight AI.
How to browse data using Baselight AI
Just type a question describing what you’re looking for — “I need unemployment data by US state” or “show me datasets on clinical trials.” Baselight AI will search the catalog and surface relevant datasets for you. No browsing required.

How to browse data in the Discover section
1. Search and Filter
From the Baselight app, open the Data Catalog tab in the top bar. You can search by keywords, tags, or providers and apply filters to narrow down your results.
Examples of searches include:
- “Inflation data”
- “US census data”
- “Macro indicators”
- “Football stats”
You can also filter by topic or data provider. For example, if you are looking for DeFi related datasets you may consider using the data provider filter and click on Portals or DefiLlama.

2. Explore Dataset Details
Click on any dataset to preview:
- The dataset name and source
- A description of the dataset
- The number and titles of individual tables contained in the dataset
- The schema and column names
- Total rows and the size of the dataset
This allows you to understand the dataset before using it in a query.

Finding the right data
To improve search results, try using more specific or domain-relevant terms. If you’re new to the platform, browsing the featured or trending sections is a great place to start. The catalog includes both public datasets and permissioned data, so you can discover a wide range of options.
Verified sources
Some datasets carry a Verified Source badge. This means the data comes directly from an authoritative provider – government agencies, official statistical organizations, or licensed data providers.
You’ll see the badge in several places: on the dataset page, in the Discover list, and in search results.
Use verified sources when data provenance matters – grant applications, research, journalism, or any work where you need to demonstrate the data came from an official source.
Data freshness
Each dataset page shows two timestamps to help you understand how current the data is:
- Last Changed – when the data source last published new data. This tells you whether the underlying data is fresh.
- Last Checked – when Baselight last verified and synced this dataset. This tells you that Baselight is actively monitoring the source.

How to read them together:
- Last Changed is recent, Last Checked is recent → data is fresh and actively maintained
- Last Changed is older, Last Checked is recent → the source hasn’t published anything new, but Baselight is still watching it
- Last Changed is recent, Last Checked is older → the dataset has not been synced with the latest data yet
For datasets you upload yourself, only Last Changed is shown – Last Checked doesn’t apply to private data.
What comes next?
After discovering a dataset, you can:
- Write SQL queries using the built-in editor
- Create visualizations directly from your results
- Upload your own data to combine with our data catalog
The Baselight Data Catalog is more than a list of tables. It is a launchpad for exploration, analysis, and collaboration.