Baselight AI is a natural language interface for querying data. Instead of writing SQL or navigating complex database schemas – ask questions in plain English.
The system translates questions into SQL, executes them against relevant datasets, and returns results with full transparency about which data sources were used.

Key features
- Natural language querying
- Zero-hallucination responses (all answers come from real data)
- Full data provenance (see exactly which datasets and tables were used)
- Works with both public catalog data and custom uploads
How Baselight AI works
Type a question in plain English in the chat input at the bottom. Baselight AI will find the right data and answer – no SQL needed. It’s also interactive: if it finds multiple relevant datasets, it might ask which one you’d like to explore rather than guessing.
Once you hit send, the AI works through the problem step by step. A new section appears below your question, showing its reasoning in plain English. Each step also shows up as a clickable pill:
- Searching Catalog – looking for relevant datasets
- Inspect Dataset – examining a dataset’s structure
- Analysing Table – looking at a specific table’s columns and rows
- Executing Query – running the SQL query
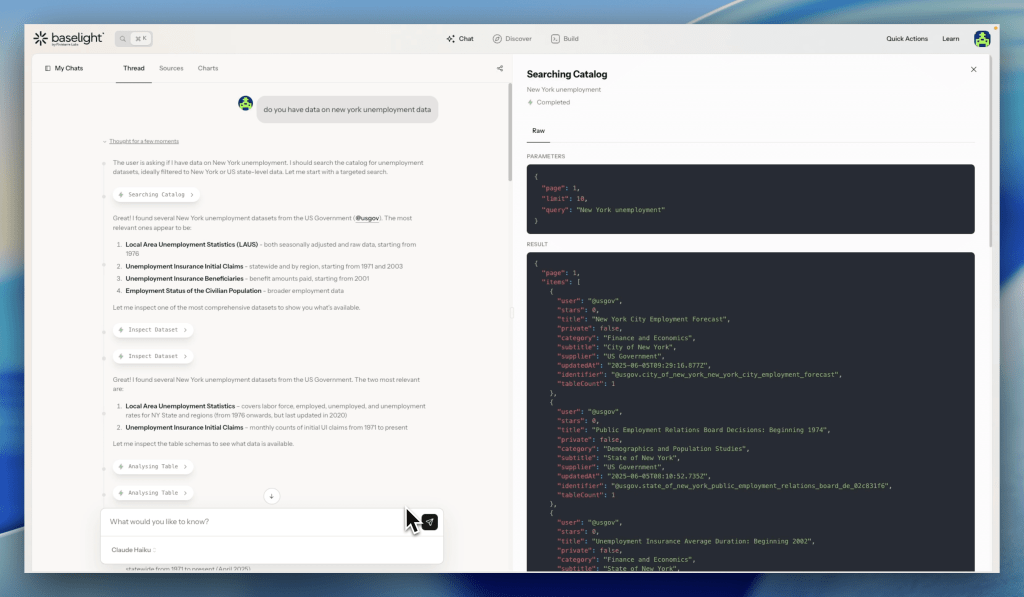
These pills aren’t just labels. Click on any of them and a detail panel opens on the right, showing exactly what happened at that step e.g.
- Searching Catalog shows the search parameters and raw results – which datasets matched and why.
- Executing Query is the most useful one. The panel has three tabs:
- Query – the full SQL that was generated. Read through it to understand how the AI got the answer. There’s a Save to My Queries button here if you want to reuse or modify it in Studio.
- Results – the data as a table.
- Raw – the same data in JSON format.
This is how Baselight AI stays accurate. Unlike traditional LLMs, it only returns data that exists in real datasets – and you can verify every step.
Your chats
All your conversations are saved automatically. Access them from My Chats on the left side of the chat interface.
Each chat is named automatically based on the topic. To manage a chat, click the three dots next to it. From there you can:
- Rename
- Share
- Delete
Sources
The Sources tab shows all the datasets that were used during your conversation. Click on it to see:
- Dataset name and description
- Who published it
- Number of tables and total size
- Last updated date and star count
This gives you a clear picture of where the data in your answers actually came from.
Charts
Baselight AI can generate charts directly in the chat. When it does, the chart appears inline with two buttons on it:
- Download – exports the chart as an image. A dialog lets you pick the size (e.g. 1200×630) and format.
- Inspect – opens the Chart Details panel on the right.
Chart Details has three tabs:
- Chart – a larger view of the visualization
- Query – the SQL behind the chart
- Results – the raw data as a table

From Chart Details you can also:
- Add to Dashboard – drop this chart directly into one of your dashboards
- Save to My Queries – save the underlying query for later use
All charts generated in a conversation are collected in the Charts tab. Click any chart there and the Chart Details panel opens on the right.
Sharing a chart
Click the share icon at the top of the chat. You’ll get two options:
- Private – only you can see it (default)
- Public Chat Snapshot – anyone with the link can view the full chat history up to that point
The public link includes a timestamp so you know exactly what’s in it.

Ask AI
Ask AI is a one-click feature available on dataset and table pages. It lets you ask Baselight AI to get familiar with a specific dataset, summarize it, and start asking questions about it.

How Ask AI works
When you click “Ask AI” on a dataset or table page, Baselight AI scopes its responses to that specific dataset only. This is useful when you want to:
- Understand what a dataset contains
- Get a quick summary of the data structure
- Ask questions about one specific dataset without searching the entire catalog
Example workflow:
- Browse to a dataset page (e.g., Ultimate Soccer Dataset)
- Click “Ask AI”
- Baselight AI summarizes the dataset and what it contains
- Ask questions that are scoped only to that dataset
- Get answers based exclusively on that data
This is different from the main Baselight AI chat, which searches across all available datasets to answer questions.
Focus areas
When you sign up for Baselight, you’re asked to pick a Focus Area. This tells Baselight what kind of work you do, so it can show you the most relevant data, questions, and dashboards right away.
Available focus areas:
- Grant Professionals – US Census, CDC, KIDS COUNT, and other public health, education, and demographics data used for needs assessments, grant justifications, and compliance reporting.
- Journalists & Newsrooms – Global development, economic, crime, and public safety data for investigative reporting and data journalism.
- Sports & Markets – Player statistics, team performance, match results, transfer markets, and league comparisons across major competitions.
- Economic Analysts – Macroeconomic indicators, monetary policy, institutional holdings, and financial market data from IMF, World Bank, OECD, FRED, ECB, and other sources.
- Data Generalists – No specific focus. You see the standard Baselight welcome page with access to the full catalog.
What focus areas change
Your Focus Area personalizes three things:
- Welcome page – Instead of a generic homepage, you see a page built for your domain: relevant data sources, suggested questions, topic cards, and popular dashboards from your field.
- Suggested questions – The “Often asked questions” on your welcome page are specific to your Focus Area. Click any of them to start a chat immediately.
- AI context – When you ask a question, Baselight AI prioritizes datasets relevant to your Focus Area. It still has access to the full catalog, so it can pull from any dataset if your question calls for it.
- Dashboards – Each Focus Area highlights dashboards with example insights built on real data from your domain. These give you a head start on the kind of analysis Baselight can do for your field.
How to pick or change your Focus Area
During signup: After creating your account, you’ll see a “What are you interested in?” step. Pick one of the five options, or click “I’ll decide later” to default to Data Generalists.
After signup: Go to Account Settings and change your Focus Area anytime. Your welcome page and AI context update immediately.