Dashboards let you combine multiple visualizations and text into a single view. Whether you’re building a report for stakeholders or putting together a data story, dashboards are the way to do it in Baselight.

Step 1: Create a new dashboard
Go to Build in the top navigation, then click the My Dashboards tab. Here you’ll see all your existing dashboards listed with their name, last updated date, and star count.
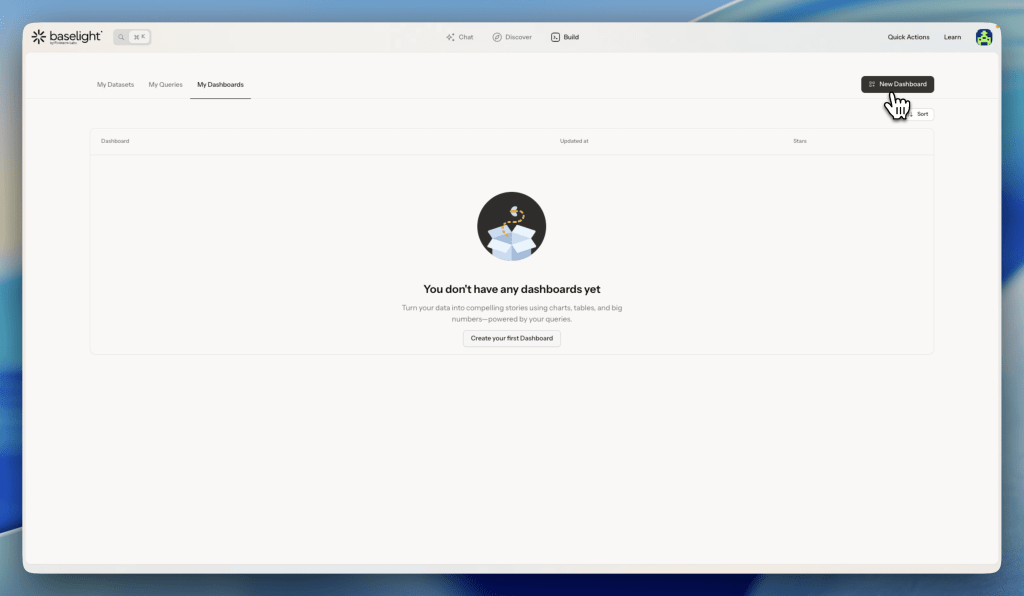
Click New Dashboard in the top right corner. A dialog will appear asking for:
- A name for your dashboard
- A short description (optional)

Click Create Dashboard and you’re in.
Step 2: Understand the editor
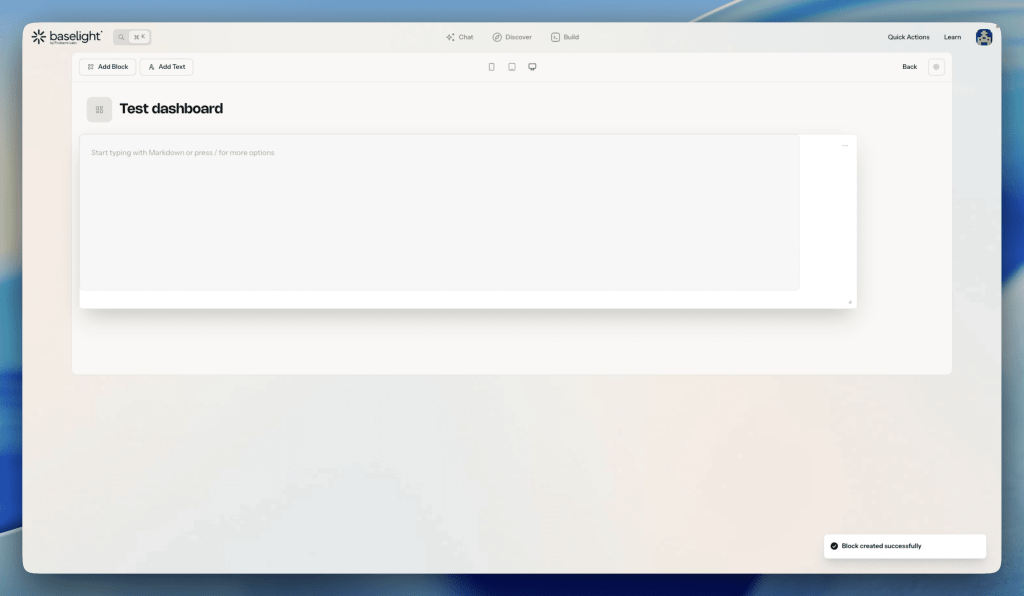
Your new dashboard opens in edit mode. It’s empty for now. You’ll see two main actions at the top:
- Add Block – adds a data visualization (chart, table, or number)
- Add Text – adds a text block for context or narrative
The same two buttons also appear in the center of the empty canvas to get you started quickly.
Step 3: Add a block
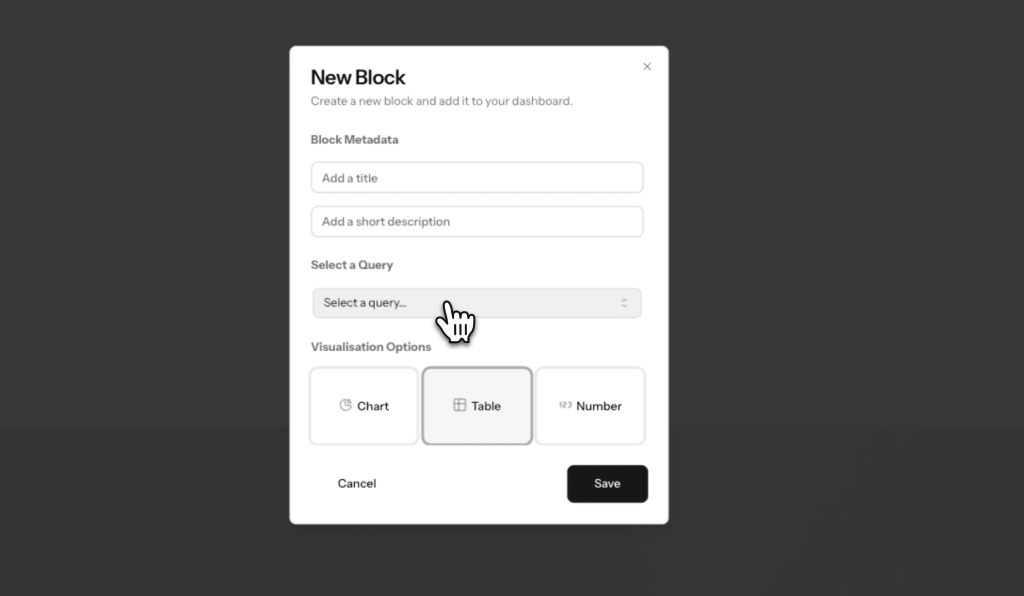
Click Add Block – either from the top toolbar or the center of the canvas. A “New Block” dialog opens with the following options:
- Title and description – give the block a name and an optional description. These show up on the dashboard.
- Select a Query – click the dropdown and search through your saved queries. Pick the one you want to visualize.
- Visualisation type – choose how to display the data:
- Chart – displays the query results as a chart
- Table – displays the data in a table format
- Number – shows a single big number. When you select this, extra options appear: choose which:
- Column to use,
- Pick an algorithm(e.g. Average),
- Set a formatter (e.g. Integer), a
- Optionally add a prefix or suffix (e.g. “$” or “%”)
Click Save and the block appears on your dashboard.
Step 4: Add Text
Click Add Text to add a text block to your dashboard. The block supports Markdown – so you can use headings, bold, lists, links, and more. You can also type “/” to pull up additional formatting options.
Text blocks are useful for adding context, explanations, or a narrative around your data.
Step 5: Arrange your dashboard and preview
Once you have blocks on the dashboard, you can customize the layout:
- Drag blocks to reorder them
- Resize blocks to make them bigger or smaller
- Arrange everything the way that tells your story best
Use the three icons in the top center of the editor to preview how your dashboard looks on mobile, tablet and desktop.
Step 6: Share your dashboard
When you’re happy with your dashboard, click the settings gear icon and select Public Dashboard. This generates a shareable link that anyone can access.