Access And Analyze Public Data Instantly
Get the numbers you need for your story instantly — just ask.
Journalism Shouldn’t Feel Like Data Archaeology
The data you need is buried somewhere
How fast can we get these numbers?
Sources are a mess
Baselight eliminates these bottlenecks by connecting you directly to structured, verifiable data—no more guessing, no more dead ends.
How Journalists Use Baselight

Trusted data from global sources


How it works
From Question to Publishable Insight
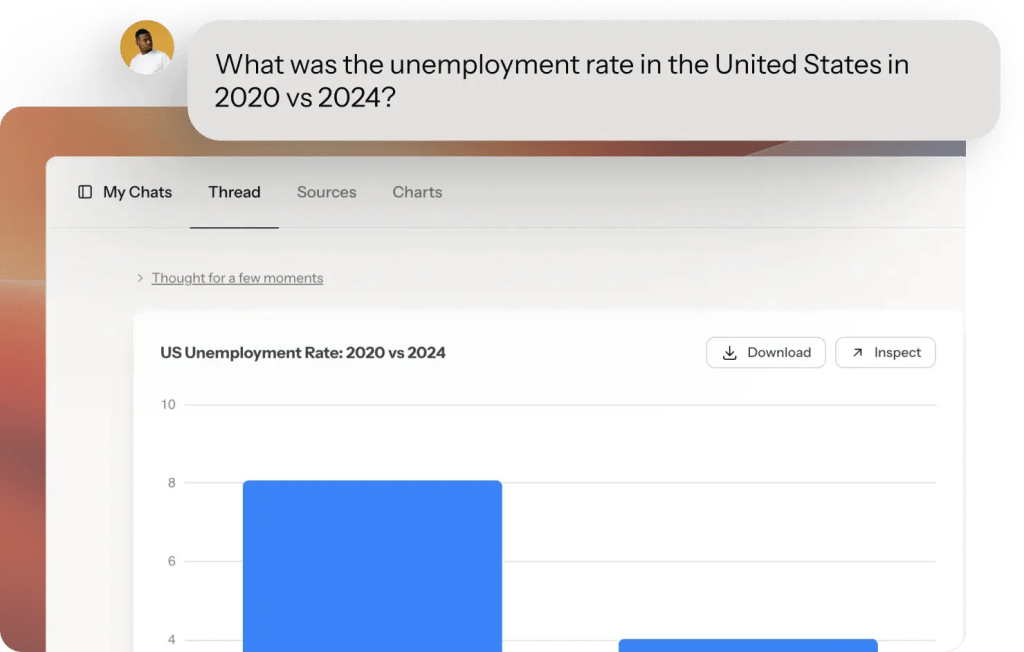
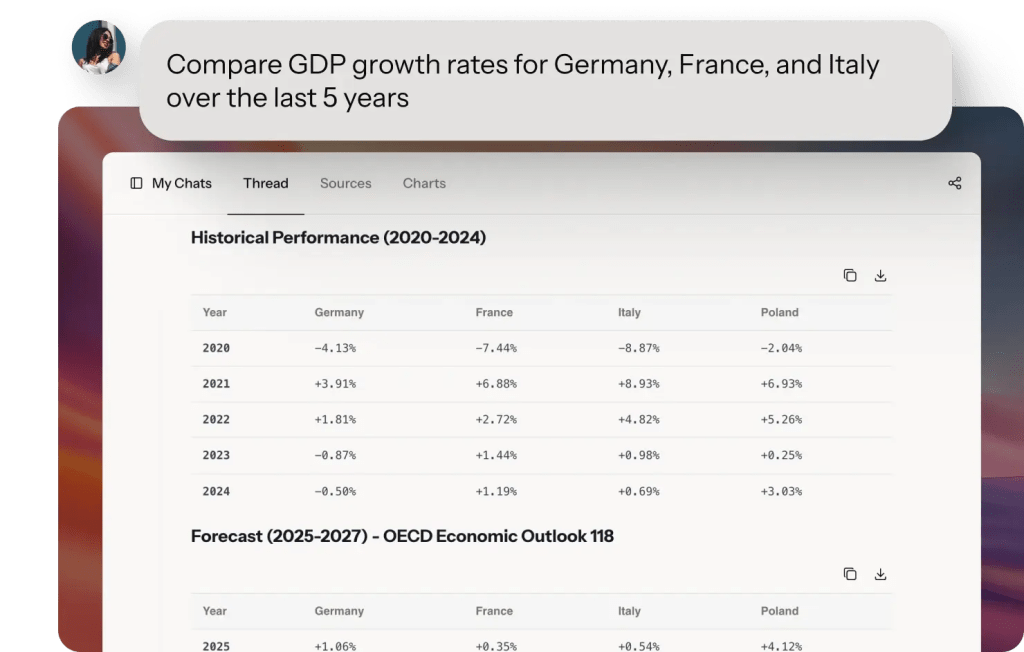
Start by asking a question
-
Ask questions in plain English (or any other language) no SQL, no formulas
-
Upload your own datasets – like documents from FOIA or local sources. Everything stays private
-
Browse datasets by topic, location, or keyword before asking questions
Get Verifiable Answers
-
Get your answer in seconds
-
All answers can be fact-checked and linked back to the original data sources
-
Every dataset includes source and methodology
-
Ask follow-up questions as you write. Refine your search until you get exactly what you need.
Visualize, Download and Share
-
Baselight will automatically create charts for your data that you can download or share
-
You can even share the whole chat conversation. with others so they see how you got to the results
-
Create dashboards to join multiple charts
We have the data you need—all tailored, all in one place.
Featured Datasets for Journalists
Eurostat
European Union Statistical Office
Comprehensive European Union statistics covering economy, population, trade, employment, migration, and social indicators for EU27 and partner countries.
Coverage
EU27 + partners, 1960-2025, Regular updates
World Bank Development Indicators
European Union Statistical Office
Economic, social, and environmental data for 200+ countries covering GDP, poverty, education, health, and infrastructure.
Coverage
1960-2025, Annual updates
WHO Global Health Observatory
World Health Organization
Comprehensive global health data including disease burden, mortality rates, life expectancy, and health system performance.
Coverage
194 countries, 4,300+ indicators through 2025
IMF World Economic Outlook
International Monetary Fund
Economic forecasts, GDP data, inflation rates, and fiscal indicators for all IMF member countries.
Coverage
1980-2025, Quarterly updates
Employment Statistics (State & Federal)
US Government (multiple state labor departments)
Job market data by industry, occupation, and geography including unemployment rates and job creation.
Coverage
National/state/metro through 2025, Monthly updates
Census
U.S. Census Bureau
Census data covers dozen of topics across 130+ surveys and programs. Browse 2.5 million tables of data!
Coverage
1900-2025, Frequent updates
Frequently Asked Questions
Ready to Empower Your Newsroom?
Join leading news organizations using Baselight to publish faster, fact-check better, and empower every reporter with data.