Get Grant-Ready Data in Minutes
Grant Writing Shouldn’t Feel Like Data Archaeology
The data you need is scattered across a dozen sources
You’re not a statistician—and you shouldn’t have to be
AI gives you numbers you can’t trust
Baselight eliminates these bottlenecks by connecting you directly to structured, verifiable data—no more guessing, no more dead ends.
How Grant Professionals Use Baselight

Trusted data from global sources


How it works
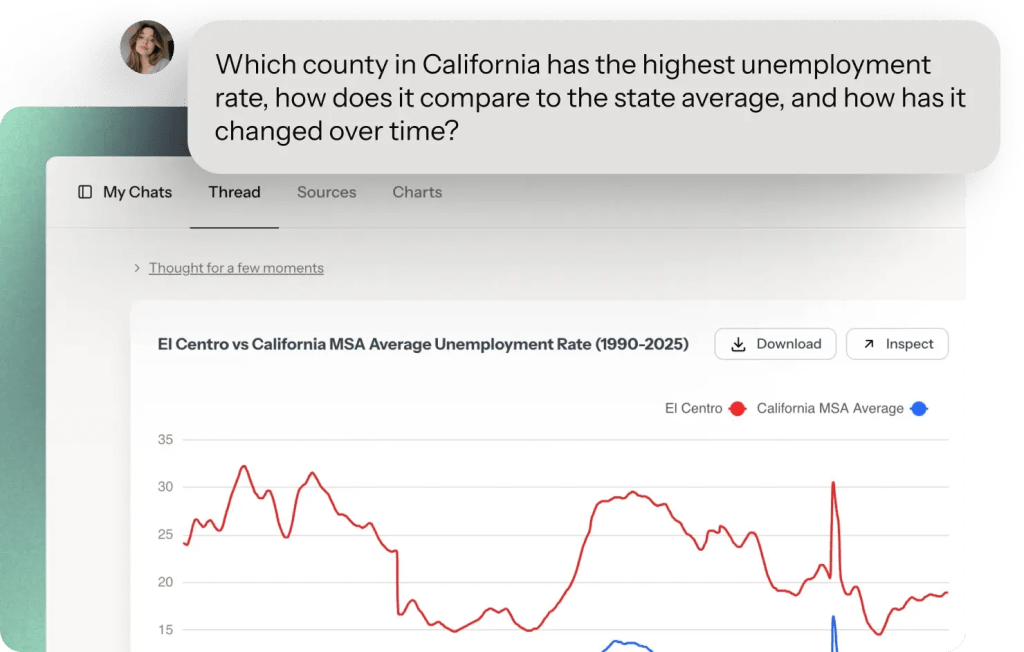
From Question to Publishable Insight
Start by asking a question
-
Ask questions in plain English (or any other language) no SQL, no formulas
-
Upload your own datasets – like documents from local sources. Everything stays private
-
Browse datasets by topic, location, or keyword before asking questions
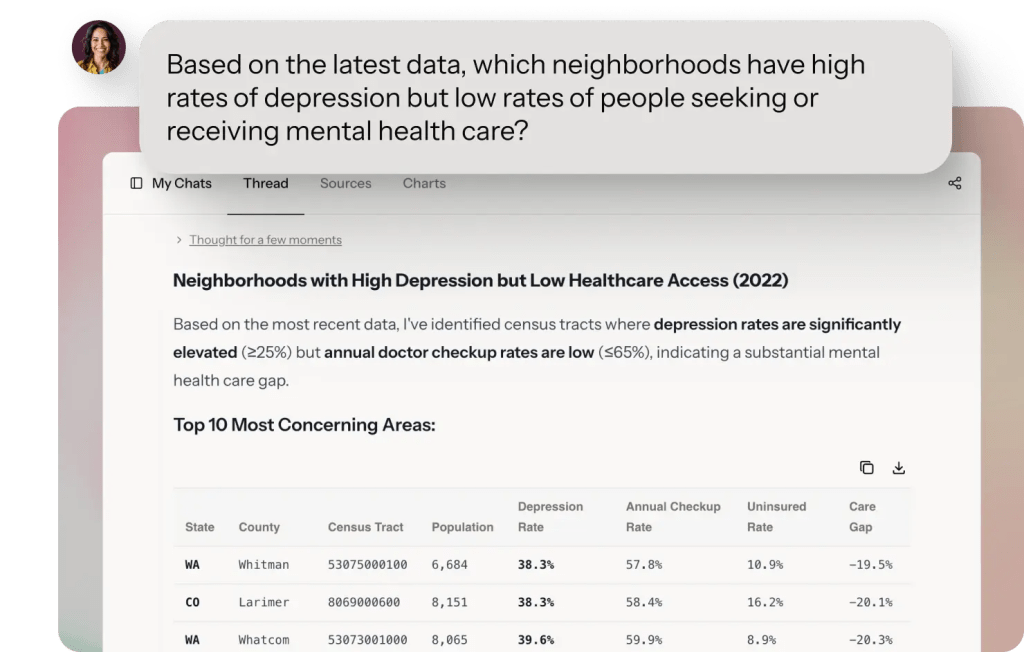
Get Verifiable Answers
-
Get your answer in seconds
-
All answers can be fact-checked and linked back to the original data sources
-
Every dataset includes source and methodology
-
Ask follow-up questions as you write. Refine your search until you get exactly what you need.
Visualize, Download and Share
-
Baselight will automatically create charts for your data that you can download or share
-
You can even share the whole chat conversation. with others so they see how you got to the results
-
Create dashboards to join multiple charts
We have the data you need—all tailored, all in one place.
Featured Datasets for Grant Professionals
Census
U.S. Census Bureau
Census data covers dozen of topics across 130+ surveys and programs. Browse 2.5 million tables of data!
Coverage
1900-2025, Frequent updates
World Bank
Development Indicators
Economic, social, and environmental data for 200+ countries covering GDP, poverty, education, health, and infrastructure.
Coverage
1960-2025, Annual updates
OWID
Our World In Data
Scientific online publication that focuses on large global problems such as poverty, disease, hunger, war, climate change
Coverage
194 countries, 4,300+ indicators through 2025
CDC
Centers for Disease Control and Prevention
Population health metrics covering chronic diseases, preventive care, health behaviors, and disabilities across all states.
Coverage
2010-2025, Annual updates
USA.gov
US Government data
Job market data by industry, occupation, and geography including unemployment rates and job creation.
Coverage
National/state/metro through 2025, Monthly updates
FRED
Federal Reserve Bank of St. Louis
Economic indicators spanning employment, inflation, GDP, housing, banking, and international trade across federal, state, and metro levels.
Coverage
1950s-2025, Daily/monthly/quarterly
Frequently Asked Questions
Not at all. You type questions in normal English, like “What’s the unemployment rate in Texas?” No spreadsheets, no formulas, no special knowledge needed.
Yes. Every answer comes from official sources (Census Bureau, CDC, County Health Rankings, Annie E. Casey Foundation) with full citations. We don’t generate or estimate data—we retrieve it.
We update almost immediately after the source agencies update. Every dataset contains information when it was last updated.
Yes. You can copy individual numbers with citations, download tables as spreadsheets, or export formatted summaries ready for your Need Statement.
Reach out to our support team and we’ll help you find the right data—or tell you honestly if it doesn’t exist.
There is a generous Free tier you can use to explore. The paid tiers start at 29$/month.
Stop Chasing Data. Focus on the writing.
Trusted by grant professionals at community nonprofits, health departments, and consulting firms across the country